


Pablo García, Director of Research and Development (R&D)
In 2024, we faced the challenge of assisting the data team of the Montevideo Municipality (IM) in generating an origin-destination matrix for the city using travel data from buses and phone movements between antennas.
The Origin-Destination Survey (EOD) is a study typically conducted every 10 years in cities on a regular weekday (a Wednesday without weather events). It is expensive and provides a “snapshot” of a significant sample of trips within the city, which is then expanded using the latest available census to create an urban planning tool that helps identify public transportation or infrastructure needs.
This snapshot is very useful but does not capture the city’s behavior on unusual days, during weather events, or social or sporting events. Moreover, the city changes significantly over a decade.
Today, electronic data sources allow us to generate an Origin-Destination matrix every hour, providing an urban planning tool that is exponentially more efficient than a snapshot taken every 10 years.
On one hand, the Municipality constructs its Origin-Destination matrix based on bus travel records. This matrix is built from a census (including all bus trips) and relies on GPS accuracy and time reports from buses.
On the other hand, there is a matrix based on mobile phone movements between antennas, which, when expanded using census data, provides a complete picture of movements across the city.
The challenge we faced, along with the IM’s data team, was that these matrices did not initially match, even though each was correct in its own right. However, it was not possible to find the Municipality’s matrix within the phone movement matrix. Due to its construction methodology, we could define the Municipality’s matrix as “Golden Records” or the true data subset that we needed to identify within the phone movement matrix.
The Validation Process
Our initial validation, which considered movements between census segments in Montevideo, showed a very low correlation. We used Tanimoto distance per hour, defining a match as when at least one movement occurred from one census segment to another in both matrices, and a difference when a movement appeared in one matrix but not in the other under the same conditions.
The initial evaluation of this match was extremely low, falling below the threshold needed to validate the matrix.
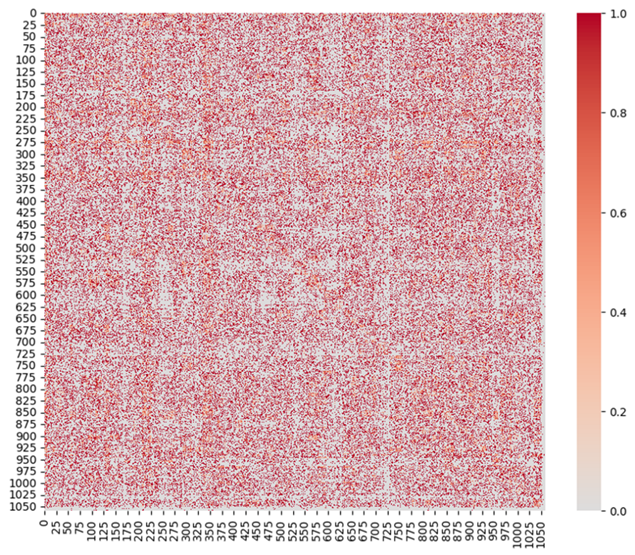
Illustration 1: Trips between census segments, hourly matches between both matrices
Despite this, we observed high correlation in some segments.
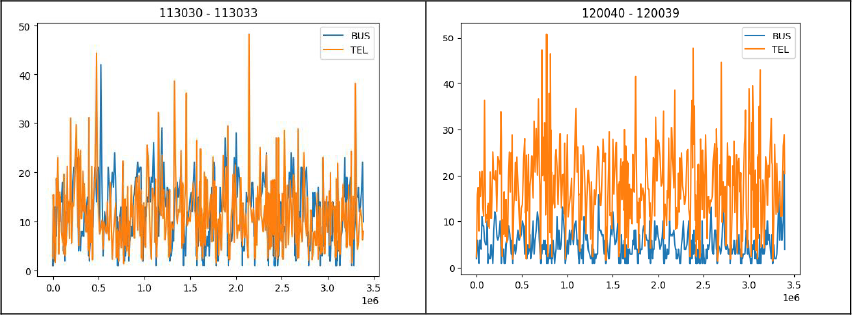
Illustration 2: Areas where bus travel and phone movement data almost perfectly correlate
These matches, although in a small percentage of segments, indicated an issue with the assignment of census segments, primarily due to technological limitations. Census segments are created using various criteria, such as whether the population lives or stays overnight in that area. However, both public transport stops, and mobile network antennas are positioned based on user needs, which correlates not only with residential areas but also with work locations and other activities (e.g., shopping, beaches, etc.).
Improving the Accuracy
To address this issue, we first adjusted the map resolution by merging some census segments. We did this by “learning” what we call the “Montevideo distribution,” which shows how the population moves to work or study.
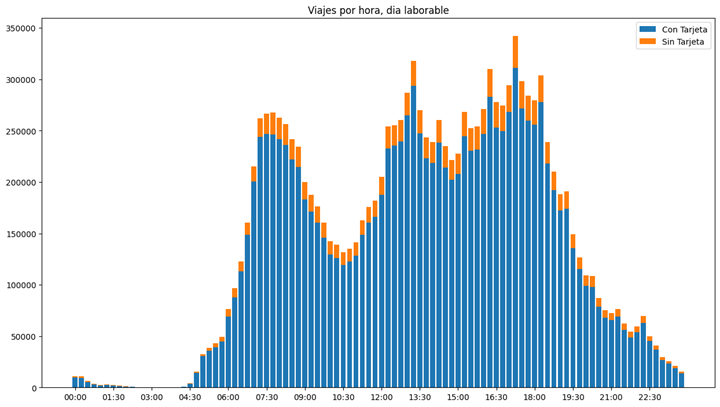
Illustration 3: Typical movement distribution of Montevideo residents for work, study, and returning home
Once this typical distribution was determined, we identified areas of the city that deviated significantly from this pattern. By merging them with adjacent sectors, we brought them closer to the expected distribution. This process reduced the study’s resolution by approximately one-tenth, consolidating about 1,000 representative census segments. This helped resolve the first source of discrepancies and improved the accuracy of our analysis.
Next, we refined the assignment of bus stop locations to census segments by considering bus routes. Initially, stops were assigned to the census segment in which they were physically located, assuming that passengers who got on or off at that stop had a final destination within that same segment.
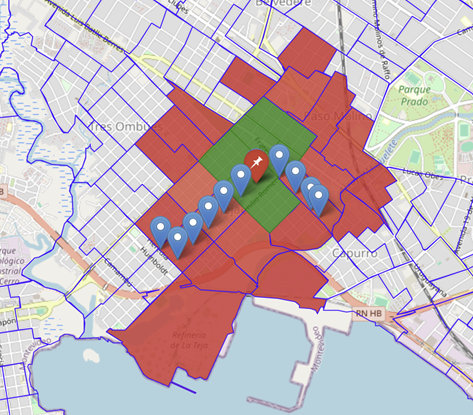
Illustration 4: Assigning destination locations for passengers alighting at a stop
We began by analyzing the coverage of mobile antennas (red zone) and incorporating the distance from each census segment to various stops. This allowed us to assign the most probable destination segments (green areas) for people alighting at the stop marked with the red pin, as they would likely have chosen a different stop if their destination were elsewhere.
This method significantly improved the accuracy of destination assignments based on each bus stop.
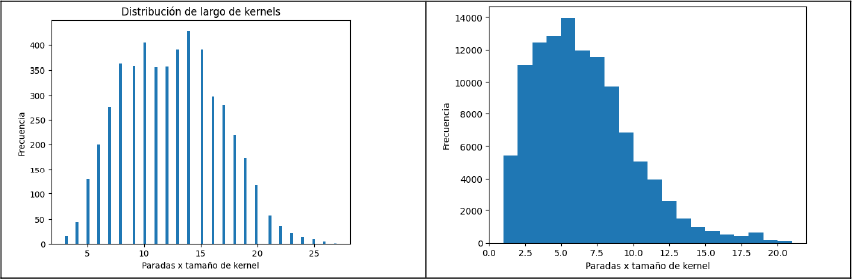
Illustration 5: Distribution of the number of census segments assigned to each stop
By incorporating probabilities (as some stops are at intersections of four different census segments), we successfully aligned both matrices, achieving the following correlation matrix:
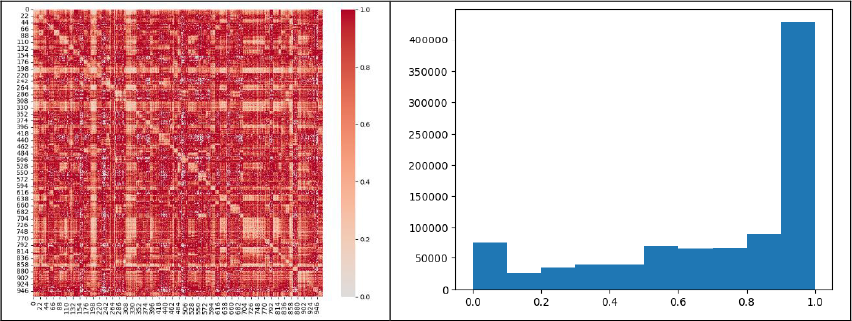
Illustration 6: Final alignment matrix and distribution of matches
Results and Future Applications
In the final analysis, we achieved a very high match rate in most census segments. In some cases, total discrepancies remained (e.g., along the diagonal), representing trips within the same census segment. Since some segments measure only two by five city blocks, it is expected that people would not take a bus for such short trips (e.g., to a nearby bakery), making these extreme divergences entirely understandable and justifiable.
By working closely with the IM data team, we have developed an urban planning tool that enables a highly detailed study of movement patterns and transportation needs across the city. This tool allows us to analyze city behavior at different times of the day, on various days, and during social, sporting, or weather events.
In summary, better data and user-friendly tools will empower IM officials to make well-informed decisions based on high-quality, up-to-date information.